
2021 ELECTIONS
The Full Picture: View the poll results via Daily Maverick’s customised provincial maps
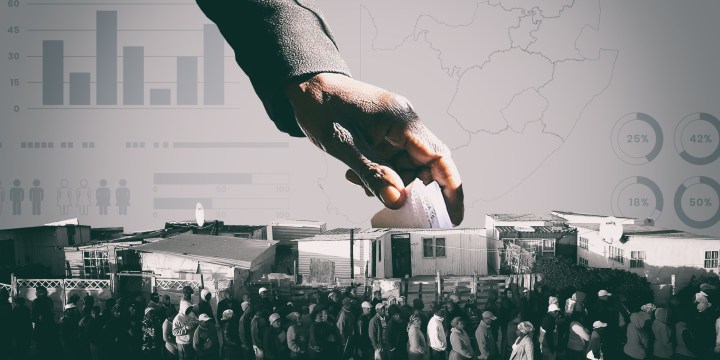
Illustrative image | Sources: EPA/NIC BOTHMA | Gallo Images / The Times / Moeletsi Mabe | rawpixel

These nine provincial interactive maps track the results for the municipal elections, and also show the 66 hung councils at a glance. They also indicate the results from the previous local government elections in 2016 – and, where relevant, how things looked before 1 November amid by-elections and coalition realignments (the incumbent). Just click on the specific municipality you wish to scan to see the pop-up details.
Jointly compiled with Victoria O’Regan and Wayne Sussman.
Explanatory Footnote:
Incumbent: The party or coalition parties that controlled the council/municipality before the 2021 election results.
Leading party: The party that got the most party ward and proportional representation votes.
Percentage: Party ward and proportional representation votes won by the leading party as a percentage of total valid votes.
Votes: The number of votes obtained by the leading party.
Seats: The number of seats obtained by the leading party.
Control: Which party or coalition parties ultimately control the council/municipality.
Turnout: Voter turnout.


Figures for DA CoCT incorect – 77 seats = 136 seats